The train arrives on time. The kopi queue moves fast. Your food delivery app updates in seconds. Singapore runs on rhythm. Yet some websites feel like they are stuck in traffic along the PIE at 6pm. You tap a link. You wait. The spinner keeps turning. You check your WiFi. Everything else loads fine. What is going on?
Website speed is not just about your internet plan. It is shaped by invisible infrastructure, distant servers, routing paths, and how efficiently a site responds to your first request. In a city built on precision and planning, even a delay of a few hundred milliseconds feels out of place. That friction changes how we experience content, services, and even local culture online.
Quick Take
- Perceived slowness often comes from latency and server response time, not just internet speed.
- Distance between user and server affects how quickly data travels.
- Time to First Byte is a key metric behind that initial loading delay.
- Simple diagnostics can reveal where the bottleneck sits.
The First Milliseconds That Shape Everything
The moment you click a link, your browser sends a request to a server. That server might be in Singapore. It might be in Sydney, Tokyo, or even California. The physical distance matters. Data still travels through cables under the sea and across continents. Even at near light speed, distance adds delay.
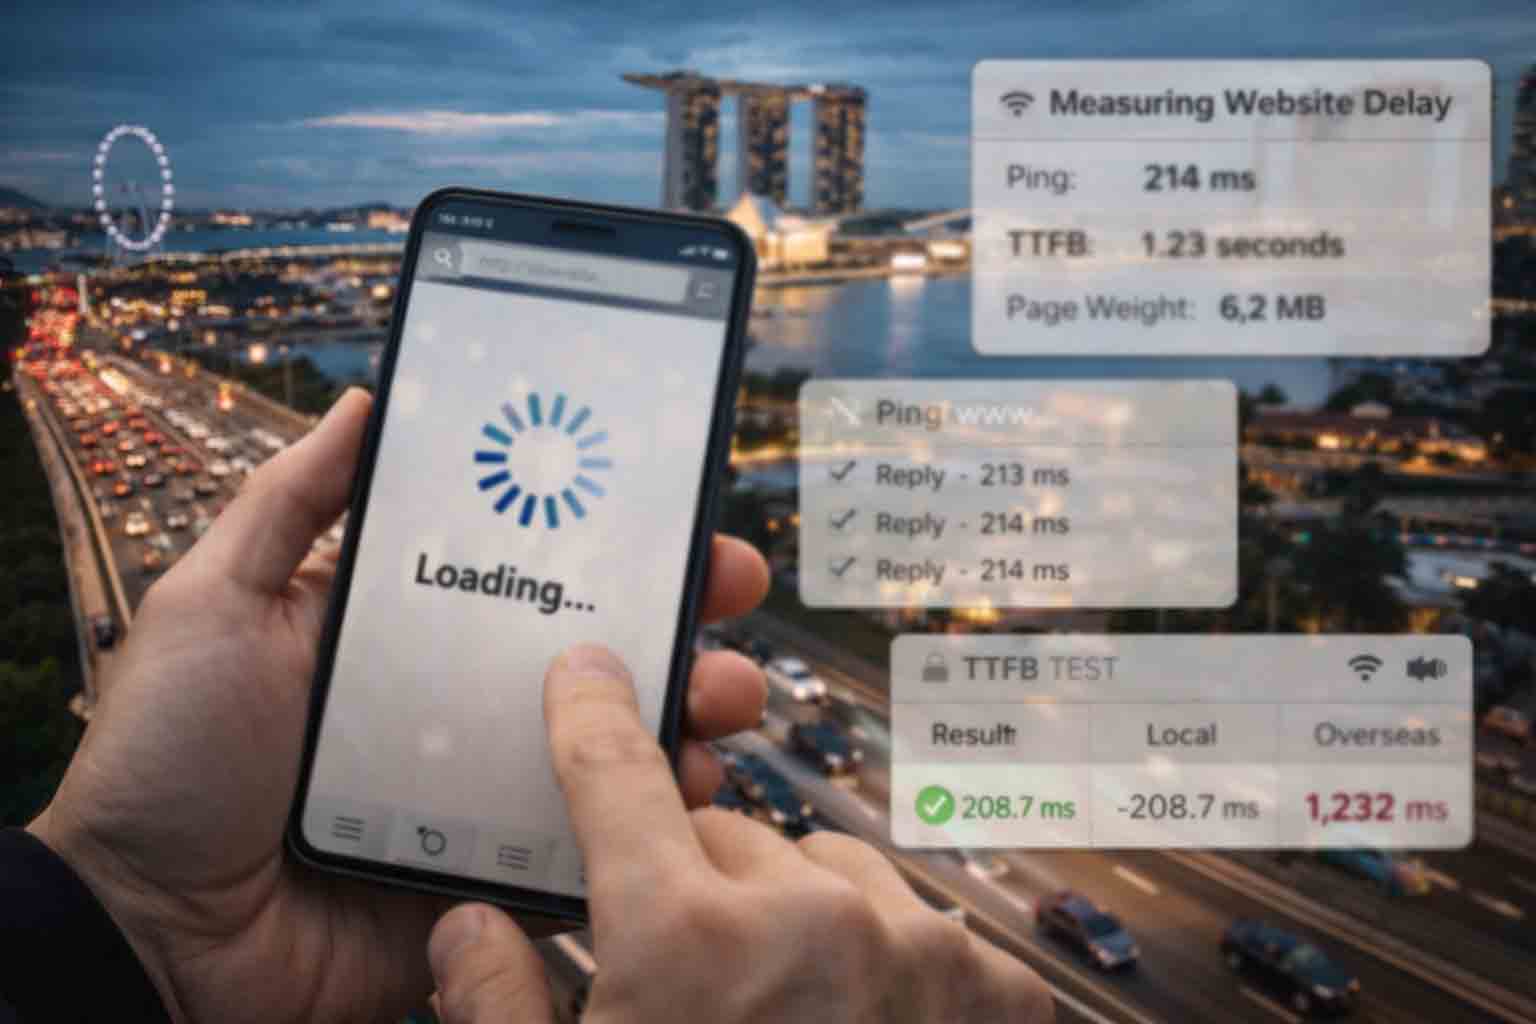
One way to measure that distance effect is through a server ping test. Ping measures latency, the time it takes for a small packet of data to travel from your device to a server and back. If a site is hosted locally, you may see a ping of under 10 milliseconds. If it is hosted overseas, that number can jump to 100 milliseconds or more.
Those numbers sound tiny. Yet our brains are sensitive to delay. Research in human computer interaction shows that delays above 100 milliseconds start to feel noticeable. At 300 milliseconds, users sense hesitation. At one second, attention begins to drift. In a city accustomed to speed, even small pauses feel magnified.
How Infrastructure Shapes Daily Digital Life
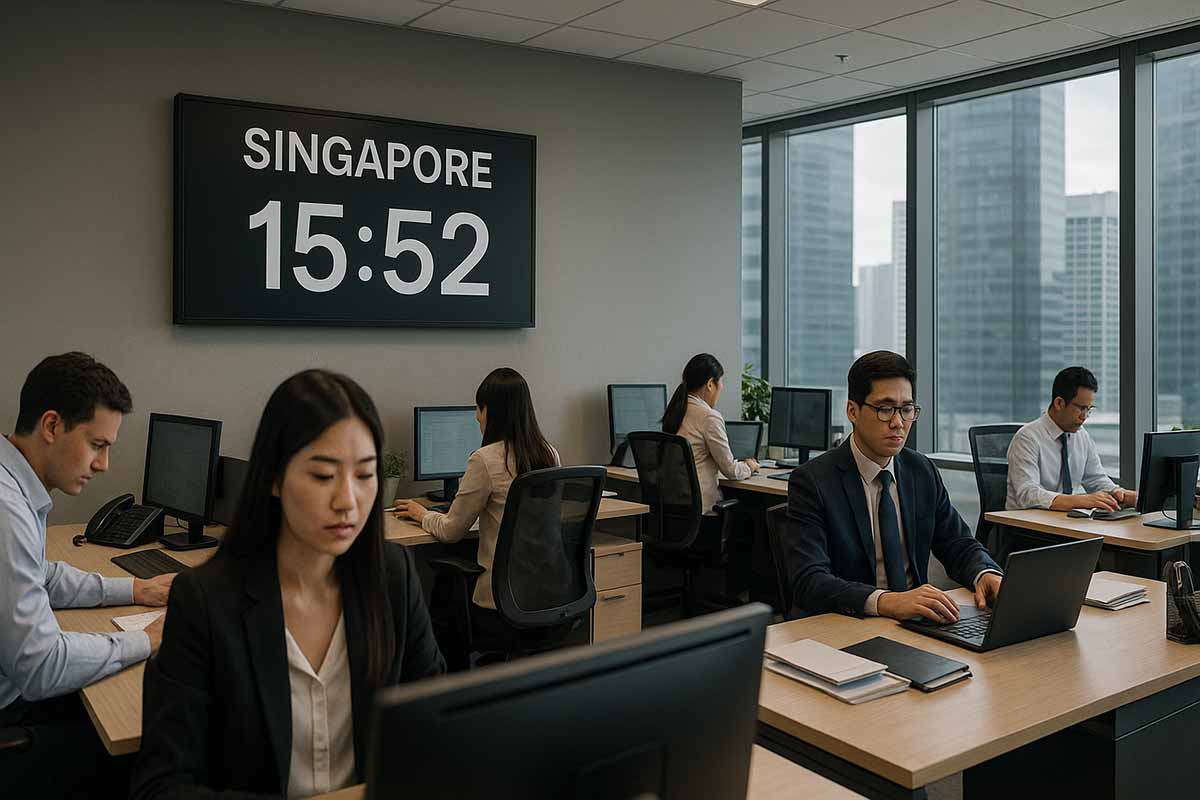
Singapore’s connectivity is world class. Fibre broadband is widespread. Mobile coverage is strong. The pace of technology changing work habits shows how deeply digital systems are embedded in everyday routines. Meetings run on cloud platforms. Banking happens through apps. Shopping and learning unfold online, all relying on seamless performance.
Yet the website itself can become the weak link. A beautifully designed site with heavy images, uncompressed scripts, and multiple third party trackers can slow down even on a fast connection. It is like driving a sports car in a narrow alley. The potential is there. The path is clogged.
Speed is not just a technical metric. It shapes trust. A government portal that loads slowly creates doubt. An ecommerce page that hesitates before showing payment confirmation creates anxiety. Performance is part of the experience. It becomes part of the city’s digital rhythm.
Understanding Time to First Byte
Latency is only one piece of the puzzle. Another critical metric is Time to First Byte, often shortened to TTFB. This measures how long it takes from the moment your browser sends a request until it receives the first byte of data from the server. It includes server processing time, database queries, and backend logic.
You can measure this using a TTFB speed test. A low TTFB suggests that the server responds quickly. A high TTFB suggests heavy backend work, inefficient code, or overloaded hosting.
Imagine ordering chicken rice at a hawker centre. If the stall owner immediately scoops rice and slices chicken, you see action right away. That is a low TTFB. If the stall owner disappears into the kitchen for a minute before you see anything, that pause feels longer than it is. The first visible sign of response matters.
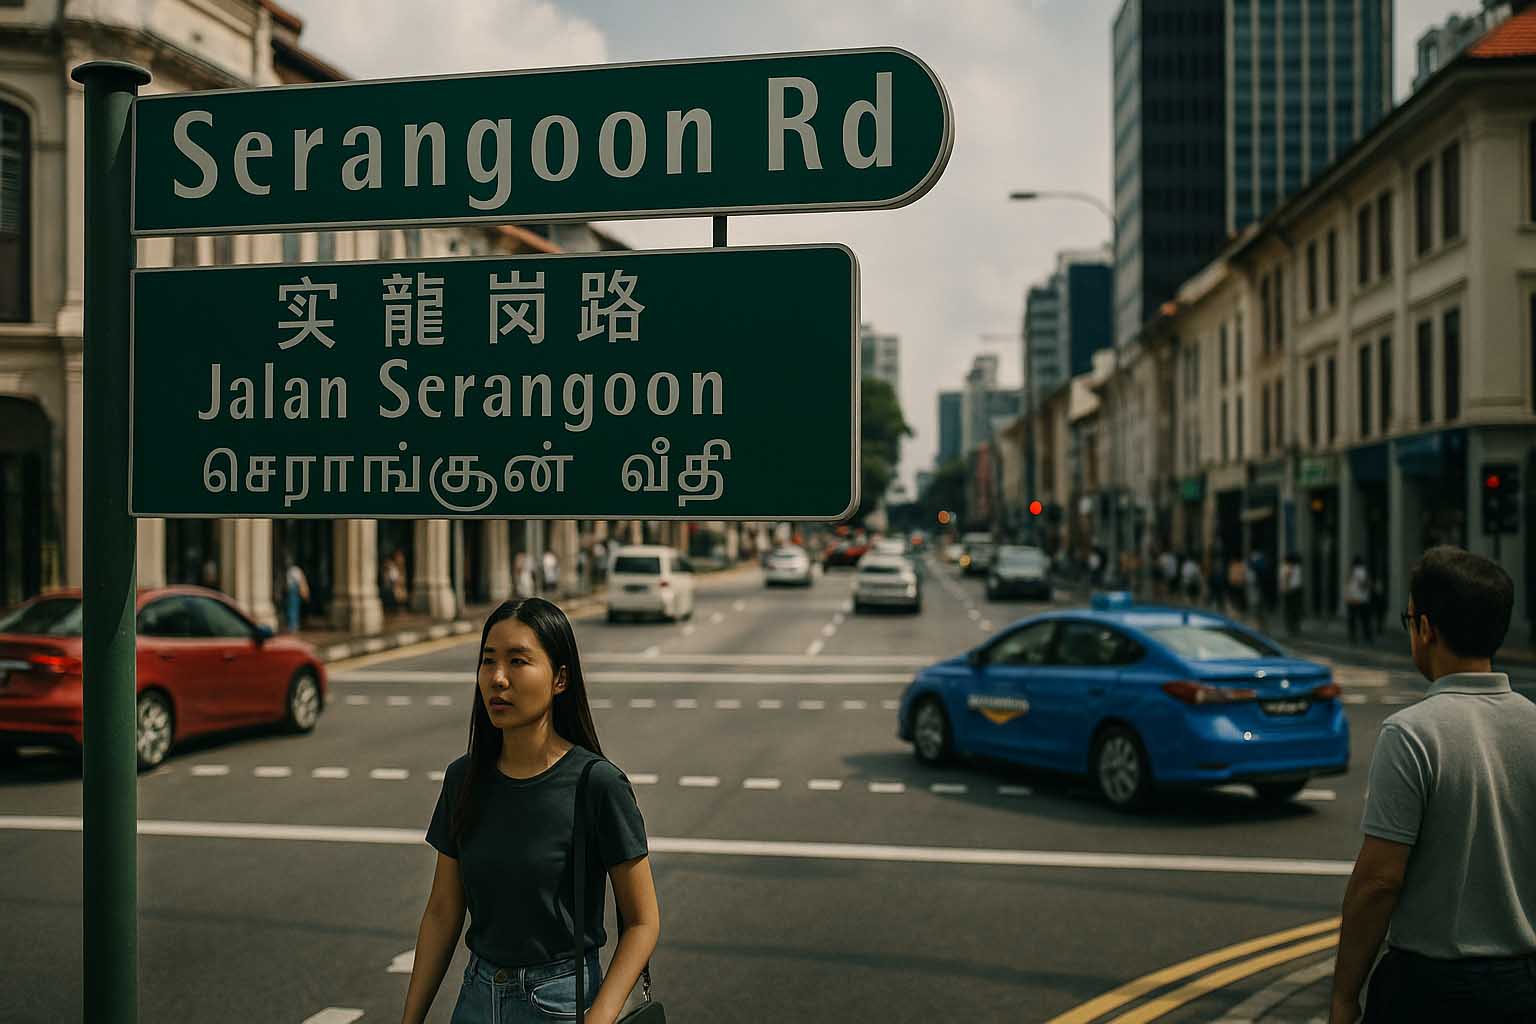
Why Two Sites on the Same Street Feel Different
It is tempting to assume that all Singapore based websites perform similarly. They share the same city, after all. Yet hosting choices vary widely. Some small businesses host their sites on international platforms with servers located far away. Others use local data centres. Some use content delivery networks that cache content closer to users.
The difference can be broken down into a few clear factors.
1. Server location. Local hosting reduces latency for Singapore users.
2. Server capacity. Shared hosting can slow down during traffic spikes.
3. Code efficiency. Poorly optimized scripts increase processing time.
4. Media weight. Large images and videos increase load time.
5. Third party integrations. Ads and trackers add extra requests.
These elements combine to shape the overall feel. A site about local neighborhoods such as Singapore’s skyline evolution may look simple on the surface. Behind the scenes, however, each image, font, and script adds weight. Optimization determines whether that weight feels light or heavy.
The Psychology of Waiting
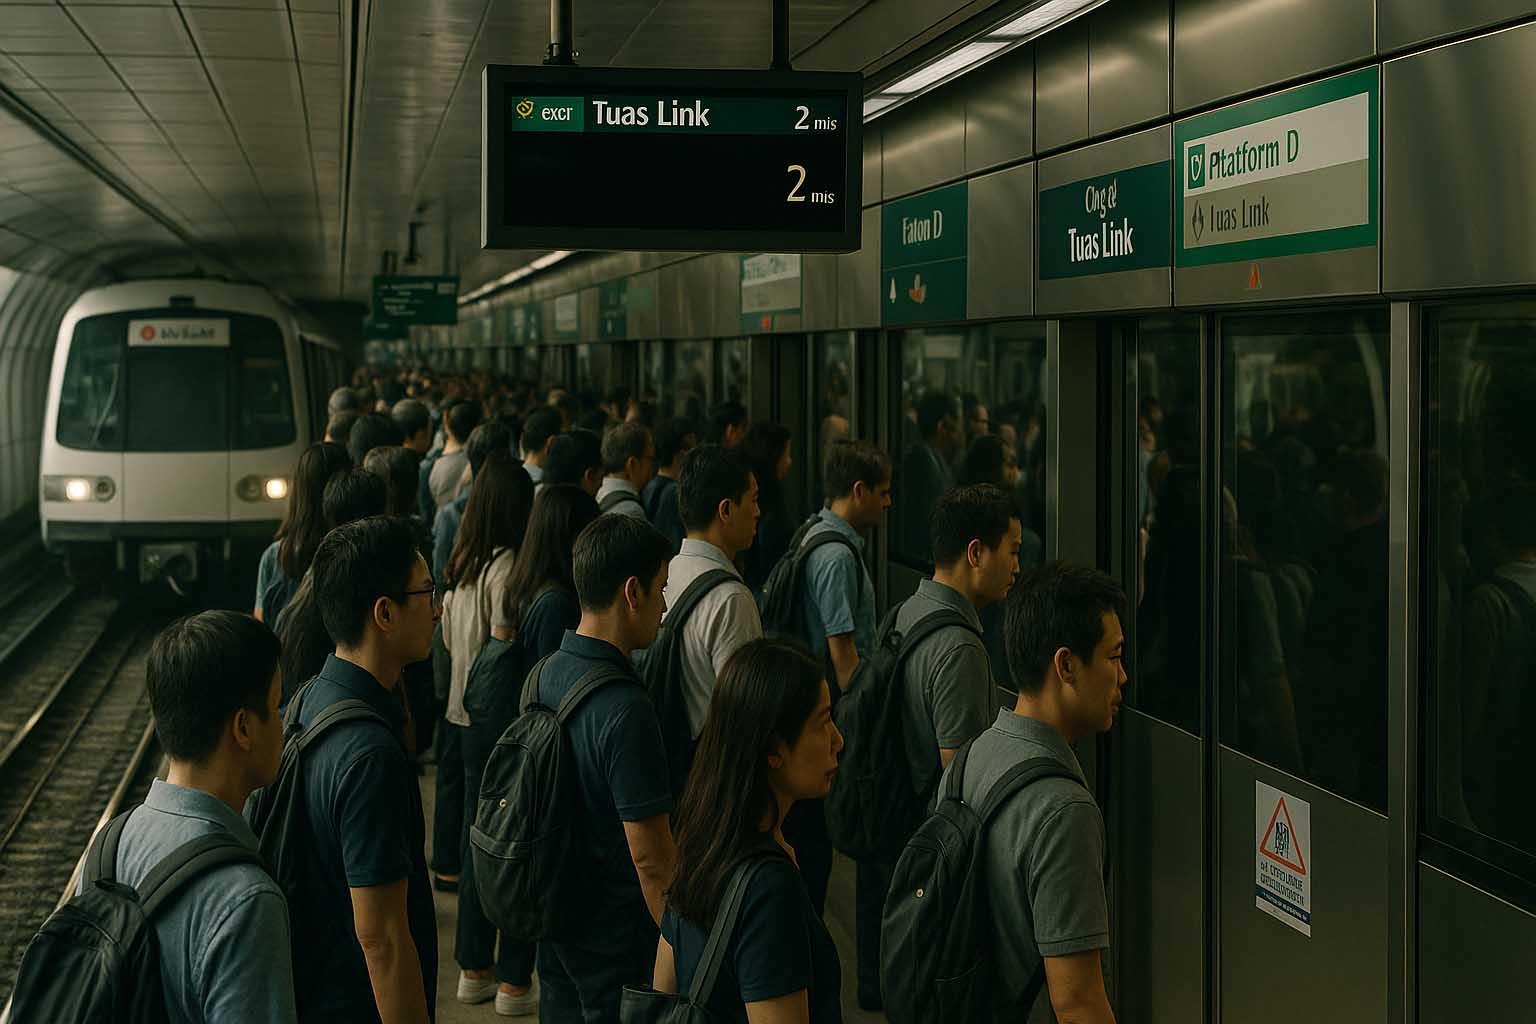
Perceived speed is not only about raw milliseconds. It is about expectation. In Singapore, efficiency is a cultural norm. MRT trains are timed. Traffic lights are synchronized. Digital services follow similar expectations. When a site lags, it breaks the pattern we are used to.
According to latency in engineering, delay in systems affects feedback loops and user perception. In online environments, fast feedback reinforces confidence. Slow feedback introduces uncertainty. That emotional layer explains why two equally functional sites can feel worlds apart.
Small design choices also influence perception. Loading indicators that move smoothly can make a delay feel shorter. Progressive loading, where content appears in stages, reassures users that progress is happening. Silence and blank screens feel longer than they are.
Above the Fold Matters More Than You Think
Web performance experts often talk about above the fold content. This refers to what you see before scrolling. If that area loads quickly, users feel the site is fast, even if lower sections take longer.
In Singapore’s fast paced environment, attention spans are short during daily commutes. Someone browsing on the MRT wants instant confirmation that the page is working. A fast header image and clear text can hold attention long enough for the rest of the page to load.
Below is a simplified comparison of key performance metrics.
| Metric | What It Measures | Impact on Feel |
|---|---|---|
| Ping | Round trip time to server | Initial connection delay |
| TTFB | Time until first byte received | Server responsiveness |
| Page Weight | Total size of assets | Overall loading duration |
Local Traffic Spikes and Hidden Bottlenecks
Speed can also fluctuate depending on time of day. During major sales events or public announcements, traffic spikes. Shared servers can struggle. Database queries stack up. Response times increase.
Unlike physical traffic jams, these slowdowns are invisible. You only see the spinning loader. The underlying cause could be a misconfigured cache or a sudden burst of visitors. In a small but highly connected country, viral content can scale quickly. Without preparation, performance drops.
This dynamic mirrors how physical infrastructure responds to crowd flow. Singapore manages traffic with data and planning. Websites require similar foresight. Caching, load balancing, and content delivery networks act like digital expressways.
Mobile Networks Add Another Layer
Many users browse through mobile data. Signal strength varies across MRT tunnels, underground malls, and high rise estates. Even if a website is optimized, inconsistent mobile latency can create uneven experiences.
Yet strong design can compensate. Lightweight pages with compressed images adapt better to variable networks. Heavy sites struggle more on mobile than on home fibre connections. This explains why a site may feel fine at home but slow on the go.
Five Signs a Site Needs Performance Attention
Performance issues often show up in subtle ways before they become obvious problems.
- Pages take more than two seconds to show visible content.
- Scrolling feels jerky due to heavy scripts.
- Forms hesitate before submitting.
- Images appear long after text loads.
- Repeated refreshes are needed to see updates.
Each of these signals points to either frontend weight or backend delay. Identifying which side is responsible helps guide improvements. Diagnostics such as ping and TTFB tests provide clarity without guesswork.
The City’s Digital Pulse
Singapore prides itself on being a smart nation. Sensors, data dashboards, and integrated systems monitor everything from traffic flow to water levels. Online platforms are part of this broader ecosystem. Speed becomes part of civic identity.
A fast site aligns with the pace of the city. A slow site feels out of sync. It interrupts the smooth flow we expect from public services, news portals, and community platforms. Over time, users gravitate toward platforms that respect their time.
Performance is not only a technical issue. It is cultural. It reflects how much value we place on efficiency and user experience. The milliseconds we ignore still shape trust and comfort.
Closing the Gap Between Click and Response
Every time you tap a link, a chain reaction begins. Data travels. Servers respond. Scripts execute. Images render. The entire process unfolds in fractions of a second. Yet those fractions determine whether a website feels effortless or frustrating.
Understanding latency and Time to First Byte makes that invisible process visible. Simple measurements reveal whether delay comes from distance, server load, or page design. Once you see the pattern, the waiting makes sense.
Singapore moves quickly. Its digital spaces should move with it. The smoother the response, the more natural the experience feels. And in a city defined by rhythm and flow, that smoothness matters more than we often realize.


Leave a Reply